Raspberry Pi Sleep Lab How-To

I have a problem. It has bothered me for years. Allow me to describe the symptoms as simply as I can:

Slumbering
Kick the covers off
I am cold

It’s time to take a stand. So I’m seeking an answer to a simple question: under what conditions do I kick off my covers during the night – and therefore how can I prevent it from happening?

My next thought, like any rational human being, was to set up a DIY Raspberry Pi Sleep Lab.

In practice, getting the metrics I wanted proved not to be so simple. Here is how I set up the experiment, in gory detail. My results are coming soon after I collect enough data to draw some conclusions.

Note: I am not a medical professional and this is not a true sleep lab. I hope to learn something from it, but obviously this would not be a replacement for consulting a physician about an actual condition.

Desired Data:

I set out to detect the following information throughout the night:

  • Video of me sleeping (to determine conclusively at what point I kick the covers off. Also shows me relative amount and quality of light in the room)
  • Room temperature
  • Room humidity
  • Body temperature (or at least near-body temperature)
  • Sleep position (back/stomach/left/right)
  • Sleep State (Awake/Light/Deep/REM)
  • Snoring
  • Outdoor Temperature
  • Thermostat Setting

Equipment:

I had most of these components already laying around from other projects.

Note: the upcoming Beddit or Withings Aura devices could probably take the place of most of these sensors (plus additionally give me breathing and heart rate data). So once those devices are available I may re-run the experiment with one of them.

Step 1: Set Up the Raspberry Pi

To configure the Pi for exactly what I needed, I adapted this tutorial. I already had Raspbian installed, did my initial config (raspi-config), and ran all the additional updates (apt-get update/upgrade, rpi-update).

During raspi-config I made sure to enable the camera module. Also SSH (under Advanced).

Step 2: Get WiFi Working

I shut down the Pi, disconnected from power, and then plugged in the WiFi dongle. The reason I disconnected from power is because in my experience plugging in the USB dongle causes the Raspberry Pi to lose power and reboot. I don’t think I’m the only one. So I like to have it off before plugging in the dongle just to be sure I’m not at risk of frying anything.

It’s nice to have the Pi hooked up to an actual screen and keyboard (rather than SSH) for this initial setup.

I booted up and logged in. Then:

$ ifconfig -a
eth0 Link encap:Ethernet HWaddr NN:NN:NN:NN:NN:NN
UP BROADCAST MULTICAST MTU:1500 Metric:1
RX packets:0 errors:0 dropped:0 overruns:0 frame:0
TX packets:0 errors:0 dropped:0 overruns:0 carrier:0
collisions:0 txqueuelen:1000
RX bytes:0 (0.0 B) TX bytes:0 (0.0 B)
 
lo Link encap:Local Loopback
inet addr:127.0.0.1 Mask:255.0.0.0
UP LOOPBACK RUNNING MTU:65536 Metric:1
RX packets:0 errors:0 dropped:0 overruns:0 frame:0
TX packets:0 errors:0 dropped:0 overruns:0 carrier:0
collisions:0 txqueuelen:0
RX bytes:0 (0.0 B) TX bytes:0 (0.0 B)
 
wlan0 Link encap:Ethernet HWaddr NN:NN:NN:NN:NN:NN
UP BROADCAST MULTICAST MTU:1500 Metric:1
RX packets:0 errors:0 dropped:0 overruns:0 frame:0
TX packets:0 errors:0 dropped:0 overruns:0 carrier:0
collisions:0 txqueuelen:1000
RX bytes:0 (0.0 B) TX bytes:0 (0.0 B)

This output indicated the Pi recognizes the dongle is plugged in. Next I needed to let it know it should use the dongle to connect to the Internet. For this section I modified this excellent tutorial.

Add my WiFi network information

Edited the wpa_supplicant file:

$ sudo nano /etc/wpa_supplicant/wpa_supplicant.conf

I made it look like this, being sure to put in my WiFi network name and password as the ssid and psk, respectively:

ctrl_interface=DIR=/var/run/wpa_supplicant GROUP=netdev
update_config=1
 
network={
ssid="Your SSID Here"
proto=RSN
key_mgmt=WPA-PSK
pairwise=CCMP TKIP
group=CCMP TKIP
psk="Your WiFi Password Here"
}

Exit with ctrl-x and save when prompted.

Tell the Pi to use WiFi when the dongle is plugged in

Next I want to edit the Network Interfaces file.

$ sudo nano /etc/network/interfaces

I’m using DHCP, so I edited the file to look like this:

auto lo
 
iface lo inet loopback
iface eth0 inet dhcp
 
allow-hotplug wlan0
iface wlan0 inet manual
wpa-roam /etc/wpa_supplicant/wpa_supplicant.conf
iface default inet dhcp

Again exit with ctrl-x and save.

Restart the network interface to see if it worked

Now I need to bring down the interface and turn it back on:

$ sudo ifdown wlan0
$ sudo ifup wlan0

I got some error messages, but it turned out to be okay. The true test is to run iwconfig:

$ iwconfig
wlan0 IEEE 802.11bgn ESSID:"Your SSID Here" Nickname:"<WIFI@REALTEK>"
Mode:Managed Frequency:2.437 GHz Access Point: NN:NN:NN:NN:NN:NN
Bit Rate:65 Mb/s Sensitivity:0/0
Retry:off RTS thr:off Fragment thr:off
Power Management:off
Link Quality=100/100 Signal level=89/100 Noise level=0/100
Rx invalid nwid:0 Rx invalid crypt:0 Rx invalid frag:0
Tx excessive retries:0 Invalid misc:0 Missed beacon:0
 
lo no wireless extensions.
 
eth0 no wireless extensions.

Prevent WiFi dongle from sleeping

With the settings above, I used to have all kinds of trouble using SSH to connect to my Pi when it was on WiFi. The connection was unreliable. Turns out that was the WiFi dongle going to sleep. That’s fine if I’m using the Pi directly, but if I need to connect to it from another machine, it needs to stay on the network all the time in order to be available on-demand. So here’s how I told the USB dongle to stay awake (this process may be different for other dongles – gosh that’s a fun word):

$ sudo nano /etc/modprobe.d/8192cu.conf

This creates a new conf file. In the file, I put:

options 8192cu rtw_power_mgnt=0 rtw_enusbss=0

ctrl-x and save.

Assign the Pi its own local IP address

I don’t want to have to hunt down the Pi’s IP address every time I want to connect. So I logged into my router and assigned the Pi a local static IP. The method for this will be different depending on the router. It’s not absolutely necessary but makes life a lot easier. Otherwise there’s also NMAP that I can run from my mac. But that’s still kind of a hack since I have to figure out which device is the Pi. Static IP is easier.

Step 3: Set Up Pi NoIR Camera for Overnight Surveillance
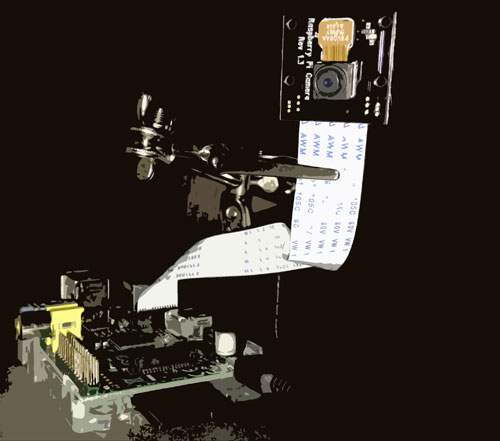
Raspberry Pi NoIR Camera

As far as the software is concerned, the Pi NoIR camera is identical to the regular Raspberry Pi Camera Module, so any tutorials for that will work for this as well.

Enable the Camera

First, I double checked that I enabled the camera module in raspi-config.

Plug In the Camera Board

sudo halt the Pi so I can plug in the camera.

It slides into the black port just behind the Ethernet port. The gold connectors on the ribbon should face away from the Ethernet port. This video has very clear instructions on how to do this.
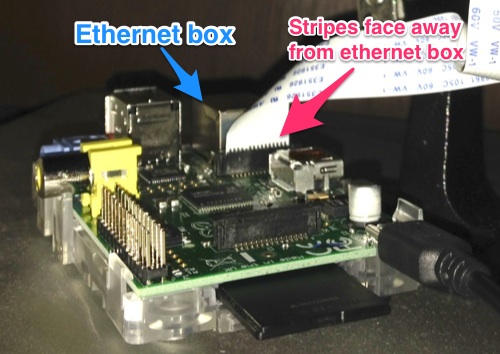
Pi NoIR Install

Booted up the Pi again and tested that the camera was working (it’s helpful to have the Pi plugged directly into a monitor at this point via HDMI or analog):

$ raspistill -t 5000

This makes the red light on the Pi Camera module turn on for 5 seconds and then turn off. Simultaneously, I saw a live video feed from the camera appear on the monitor I had connected to the Pi’s HDMI port. The video should last for 5 seconds and then go away.

Troubleshooting

At this point I briefly ran into a problem: whenever I launched raspistill it would hang. The camera’s red light would come on but I wouldn’t get any video stream and the light wouldn’t turn off after 5 seconds. It just stayed on, even after ctrl-c. Camera was basically non-responsive (although the Pi itself seemed fine). Finally solved this by shutting down the Pi, disconnecting the camera, and reconnecting it. Something about the physical connection wasn’t quite right and adjusting it fixed it (thanks, Stack Exchange!).

So anyway, at this point I had video, so good so far.

In addition to raspistill there is also a function called raspivid but neither of these really worked for my purposes. I was setting up more of a timelapse cam, so I only needed a framerate of about 1 frame for every 5 seconds. And it’s important that I have accurate timestamp data because I’ll need to line up the video with my other data streams later – so this makes me want to save out still JPEGs instead of one big video file, and save each of them with a timestamp in the filename as well as overlaid on the image itself.

Install a custom version of Motion

There is a fantastic program out there called Motion that has an enormous feature set, including overlaying timestamp data directly onto each frame. It can be set up to record video only when the camera senses movement (sweet!) although for this experiment I preferred to get frames at regular intervals for the whole night (which it can also do).

Motion works with USB webcams connected to the Pi, but it takes some hacking to get it to work with the Pi Camera module. Fortunately someone has done exactly that.

First, I followed this tutorial from

sudo apt-get install motion

on down until I got to the step where you set up the configuration file:

nano motion-mmalcam.conf

I made some modifications that are necessary for this project to work. I used ctrl-w to search through the document to find each of these settings.

logfile /home/pi/mmal/motion.log
...
width 1024
height 576
framerate 2 #doesn't matter too much since minimum_frame_time will intercede
minimum_frame_time 5
mmalcam_use_still on
emulate_motion on
output_pictures on
ffmpeg_output_movies off
ffmpeg_timelapse 0
snapshot_interval 0
text_right %Y-%m-%d\n%T-%q
text_left Pi-cam %t
text_event %Y%m%d%H%M%S
target_dir /home/pi/m-video
snapshot_filename %Y%m%d%H%M%S-snapshot
picture_filename %Y%m%d%H%M%S-%q
movie_filename %Y%m%d%H%M%S
timelapse_filename %Y%m%d-timelapse

These settings tell Motion to act as though movement is constantly being detected. Instead of outputting a video file, it outputs a jpeg frame every 5 seconds. That frame is saved as a JPEG with a timestamp as its filename. By default it includes an “event” number in the filename, events being a number that gets incremented every time the program detects movement. Later on I used Quicktime to easily combine all the JPEGs into a video file, but I found that the event number throws things off, so I eliminated it from the JPEG filenames.

I left the width and height at 1024×576 because it was the highest of the three tested resolutions. Because I’m only grabbing 1 frame every 5 seconds and I’m using a 16GB SD Card, space isn’t too much of a concern (running Motion for ~7 hours overnight gave me ~5000 jpeg frames at ~40KB per frame, totaling ~200 MB).

Once I made the changes, I ctrl-x to close the file, confirming that I want to save.

To help avoid confusion about which version of Motion I’m using, I renamed this custom version of Motion:

$ mv motion motion-mmal

Now I can start Motion using this command (making sure I’m in the mmal directory):

$ ./motion-mmal -n -c motion-mmalcam.conf

When I do this, the Pi Camera’s red light turns on. This also starts a live video stream that I can see via HDMI, and access from my macbook using a browser (type the Pi’s IP address into the address bar with port 8081 – e.g. http://192.168.1.5:8081) or VLC player (Open Network – command-N).

ctrl-c stops the video stream.

I also used the instructions at this tutorial to create a “startmotion” and “stopmotion” script to make starting and stopping the process easier to do and remember.

Camera Test

My last stage was to bring the Pi into the production location and get the lighting and camera positioned. I did a sudo halt, disconnected the Pi from my monitor and took it to my room.

Camera Position
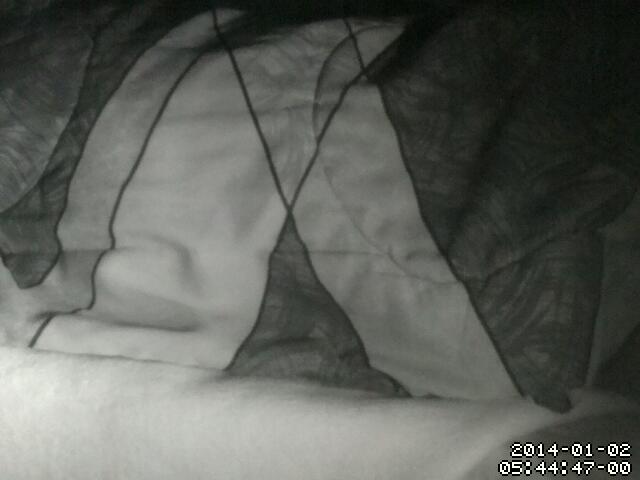
My very first camera test was not in an ideal location - too close up to be able to really see what was going on with the covers

My very first camera test was not in an ideal location – too close up to be able to really see what was going on with the covers

Raspberry Pi Sleep Study

Fixed this on my next try.

I found a bookshelf that was within range of my power outlet and set the Pi on it. I used the third hand tool to keep the Pi in place and angle the camera. Then I brought my Macbook in and started an SSH session into the Pi from Terminal using

$ ssh [pi's.ip.address]

Then entered the password and once in I started the video feed:

$ cd mmal
$ ./startmotion

Red light turns on, all is well. I connected to the feed in VLC on my Mac and used that as my viewfinder to tweak the camera angle (note: I usually experience 5-10 seconds of lag between adjusting the camera and seeing it update in VLC). I found an angle where I could see the top, side, and floor just beneath my bed, so I could clearly tell where the covers were at any given time, and also visually see what contortions I might go through during the night.

Update: I have since discovered that starting Motion and viewing the feed is even easier from my iPhone than from my Mac (much simpler form factor for this environment). The iOS Server Auditor app provides a fantastic SSH terminal into the Pi, and the VLC app works better than Safari mobile for viewing the feed. Remember to turn on the phone’s WiFi connection or these apps won’t be able to connect.

Lighting

Lighting is a little bit tricky in that I can’t see the infrared light with my own eyes. It’s just a super faint red glow. So: with my Mac still connected to my video feed I turned off all the regular lights, plunging the room into near-darkness and navigating by the glow from my laptop.

Navigating by Applelight

Wow, you can tell I’m using f.lux. And yes… I may have lost some sleep while setting this up.

I plugged in the infrared LEDs and watched the video feed on my computer screen to see what angle worked best. The LEDs are very bright when viewed through the camera, so I found that I actually got better, more even, less intense illumination by aiming the light directly at a white wall from about 2-3 feet away. That way the light dispersed before hitting the bed and me, contrast was decreased, and the camera could see more.
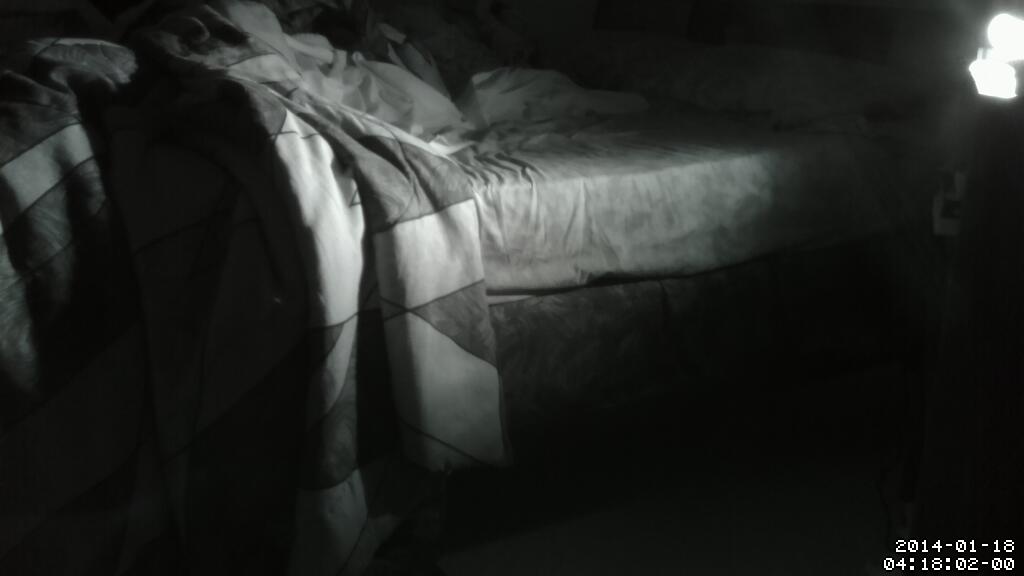
Nope - lighting is too direct, producing dark shadows I can't see into

Nope – lighting is too direct, producing dark shadows I can’t see into
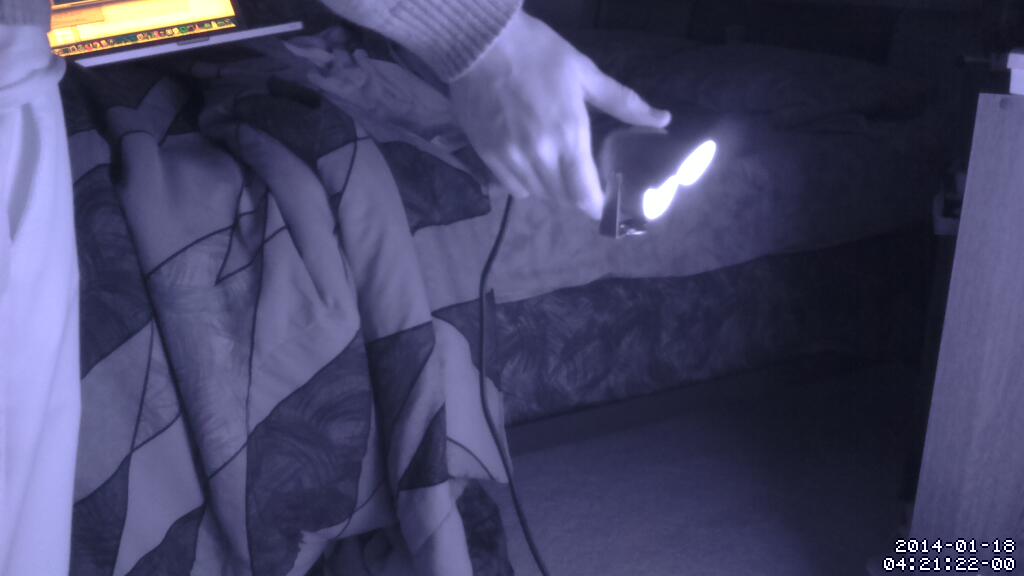
Ah, now we're onto something.

Ah, now we’re onto something.

Initially I was concerned about shining a light on myself all night (even if it’s not visible) because of the way light is supposed to affect melatonin production, circadian rhythms, yada yada, but this leads me to think that it probably wouldn’t have much effect because IR light is on the red end of the spectrum. But regardless, diffusing the light seems to be better all the way around for this experiment.
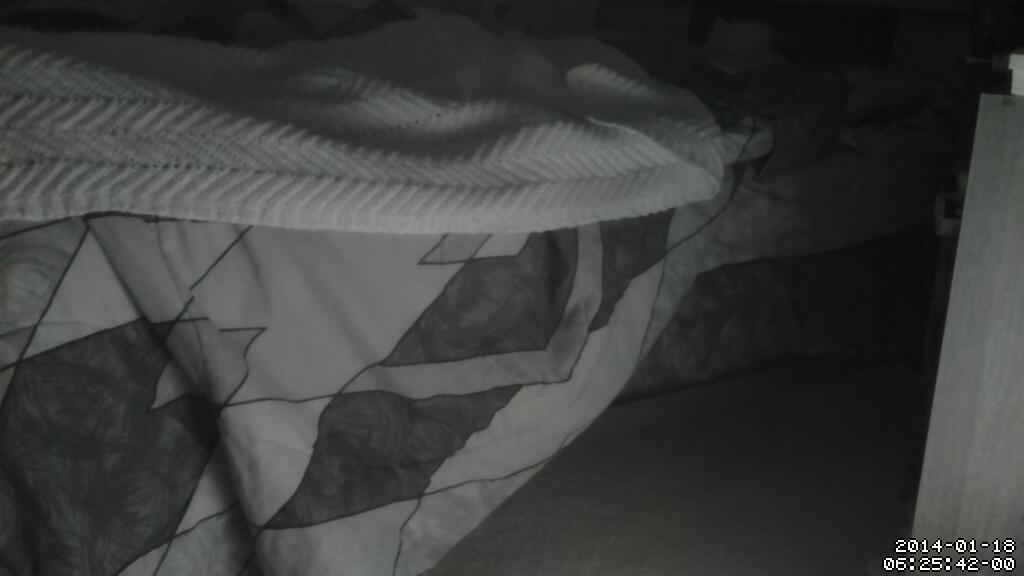
Raspberry Pi Sleep Study

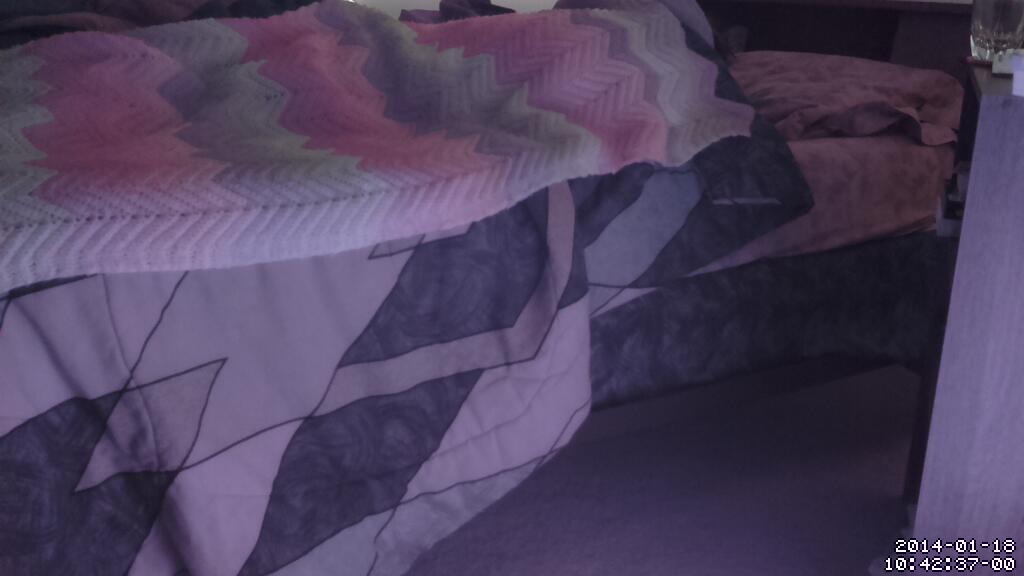
The infrared light is placed just below the frame on the right side, and is pointing at a white wall near the nightstand, which diffuses the light into the room.
Raspberry Pi Sleep Study

The IR light is still on, but as daylight returns in the morning, it’s cool to see the colors return to my top blanket – they’re not visible by IR light alone.

At this point, the Raspberry Pi is ready to watch me sleep through the night. If I were solely combining this with other off-the-shelf sleep monitors, then I’d say I’m done. But in my case I wanted to set up some sensors that would give me data I couldn’t get from the BodyMedia armband or the LumoBack or Zeo Sleep Manager. So at this point this project also becomes an Arduino Sleep Lab. But I’ll still be using the Raspberry Pi to receive and record the data from the Arduino.

Step 4: Sensor Madness

Although it’s possible to plug sensors directly into the Pi using its GPIO pins and the Pi Cobbler, I already had most of these sensors working with the Arduino Uno from previous projects. And I discovered that it is very easy to get the Arduino to send values to the Pi via a long USB cable, which would also allow me to place the sensors closer to me than to the Pi (which is convenient because the Pi camera needed to maintain a certain distance). I used two sensors:

  1. DS18B20 – A temp sensor at the end of a long cable that I could place under myself while sleeping. Modified this tutorial
  2. DHT11 – A combo temp & humidity sensor to measure ambient room temp & humidity. Used this library.

Here’s how I hooked everything up:
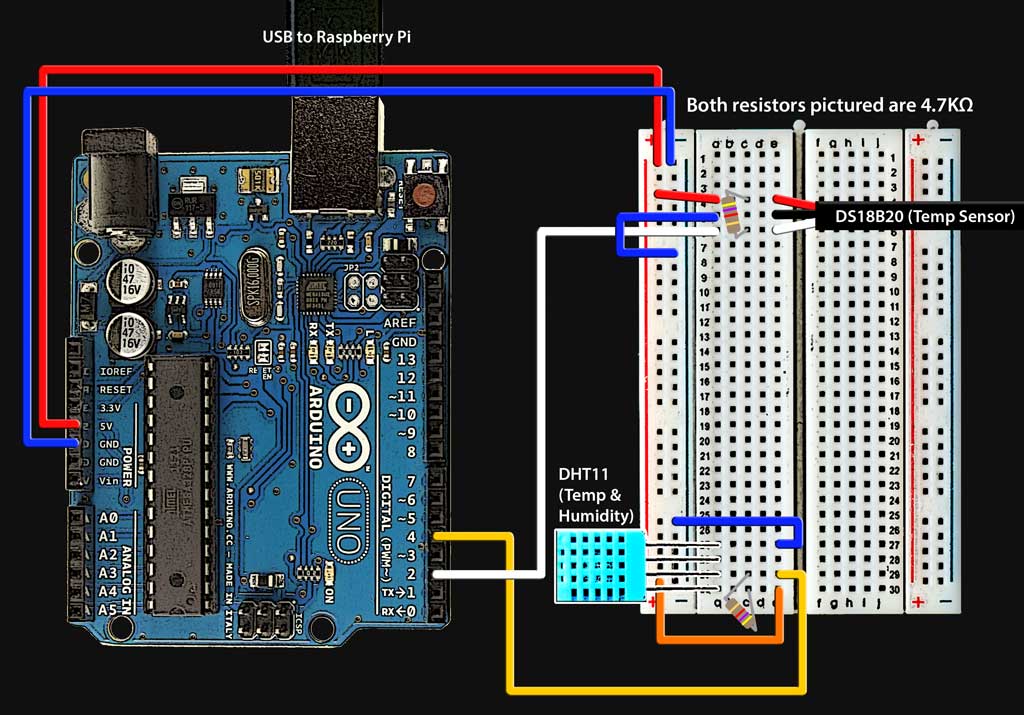
Arduino connected to the DHT11 & DS18B20 Temp Sensors

Arduino connected to the DHT11 & DS18B20 Temp Sensors. Resistors are 4.7KΩ
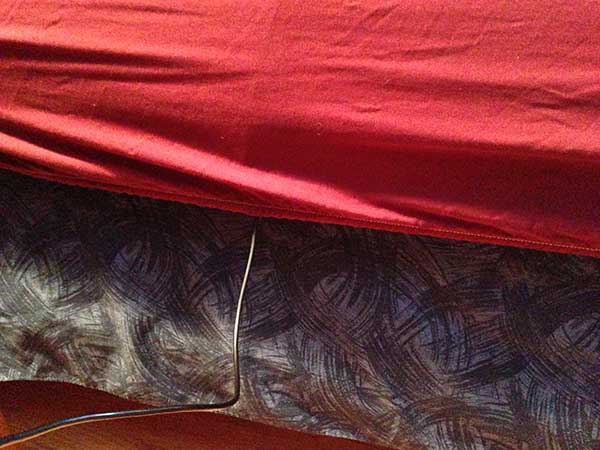
DS18B20 Temp Sensor cable fed under my bottom sheet so the tip is between me and the mattress

DS18B20 Temp Sensor cable fed under my bottom sheet so the tip is between my lower back and the mattress. When it’s under the small of my back I can’t even feel it. It’s probably not getting true body temperature readings, but I’m still hoping to be able to correlate it to my sheet-kicking data.

Here is my finished Arduino sketch, which tells the Arduino to send the following comma-separated row of data over serial USB once per minute:

humidity(%),roomTempF,bodyTempF

And here’s the Arduino sketch that gets me that:

1
2
3
4
5
6
7
8
9
10
11
12
13
14
15
16
17
18
19
20
21
22
23
24
25
26
27
28
29
30
31
32
33
34
35
36
37
38
39
40
41
42
43
44
45
46
47
48
49
50
51
52
53
54
55
56
57
58
59
60
61
62
63
64
65
66
67
68
69
70
71
72
73
74
75
76
77
78
79
80
81
82
83
84
85
#include <OneWire.h>
#include <dht11.h>
 
int DS18S20_Pin = 2; //DS18S20 Signal pin on digital 2
 
dht11 DHT11;
 
//Temperature chip i/o
OneWire ds(DS18S20_Pin); // on digital pin 2
 
void setup(void) {
 DHT11.attach(4);
 Serial.begin(9600);
}
 
void loop(void) {
 
 //DHT11 Temp and Humidity Sensor
 getHumidity();
 Serial.print(",");
 
 //OneWire Long Temp Sensor
 float onewireTemperature = getTemp();
 onewireTemperature = onewireTemperature*9/5+32;
 
 Serial.println(onewireTemperature);
 
 delay(60000); //take the reading once per minute
 
}
 
void getHumidity(){
 
  Serial.print((float)DHT11.humidity, 2);
  Serial.print(",");
  Serial.print(DHT11.fahrenheit(), 2);
 
}
 
float getTemp(){
 //returns the temperature from one DS18S20 in DEG Celsius
 
 byte data[12];
 byte addr[8];
 
 if ( !ds.search(addr)) {
   //no more sensors on chain, reset search
   ds.reset_search();
   return -1000;
 }
 
 if ( OneWire::crc8( addr, 7) != addr[7]) {
   Serial.println("CRC is not valid!");
   return -1000;
 }
 
 if ( addr[0] != 0x10 &amp;&amp; addr[0] != 0x28) {
   Serial.print("Device is not recognized");
   return -1000;
 }
 
 ds.reset();
 ds.select(addr);
 ds.write(0x44,1); // start conversion, with parasite power on at the end
 
 byte present = ds.reset();
 ds.select(addr);  
 ds.write(0xBE); // Read Scratchpad
 
 
 for (int i = 0; i < 9; i++) { // we need 9 bytes
  data[i] = ds.read();
 }
 
 ds.reset_search();
 
 byte MSB = data[1];
 byte LSB = data[0];
 
 float tempRead = ((MSB << 8) | LSB); //using two's compliment
 float TemperatureSum = tempRead / 16;
 
 return TemperatureSum;
 
}

Now the Raspberry Pi needs to know how to receive it. I installed the PySerial library, which is an easy way for the Pi to communicate over its USB port.

Install PySerial on the Raspberry Pi

Download the latest PySerial source.

Save the pyserial-2.7.tar.gz file somewhere on the Pi and then cd into that directory.

Next I unzipped the file and then did a cd into the folder that gets created:

$ tar -xvzf pyserial-2.7.tar.gz
$ cd pyserial-2.7

Now I can actually do the install:

$ sudo python setup.py install

Next I followed this tutorial, to actually write my Python script.

Here is my sleeplogger.py Python data logger script, which I save to the Pi in the mmal directory with the rest of my files:

1
2
3
4
5
6
7
8
9
10
11
12
13
14
15
16
17
import serial
import csv
import datetime
ser = serial.Serial('/dev/ttyACM0', 9600) #use this line when running this script on the Raspberry Pi
#ser = serial.Serial('/dev/tty.usbmodemfa131', 9600) #use this line when running this script on my Mac
flag = 0;
while 1 :
	ts = str(datetime.datetime.now()).split('.')[0]
	out = ser.readline()
	out = ts+","+str(out)
	if flag > 0:
		print(out)
		file = open("sleep_temp_hum_data.csv", "a")
		file.write(out)
		file.close()
	else:
		flag = 1

Time to test that it’s working. I plug the Arduino into the Raspberry Pi’s USB port. Then I cd into the mmal directory and run the sleeplogger.py script:

$ python sleeplogger.py

Command-line outputs should start appearing that resemble this:

2014-02-28 02:56:54,35.00,73.40,66.09

Hey, data!

Stop the script when ready using ctrl-c.

NOTE: the script is set to communicate only once every minute. For testing purposes, I found it useful to temporarily increase the output frequency in the Arduino sketch and reload it onto the Arduino.

I also double checked that the data were being recorded, not just output to the command line. Doing an ls in the mmal directory should reveal a file called sleep_temp_hum_data.csv. sudo nano into it just to double check that records were recorded and the formatting looks okay.

Auto-activate sensors when video starts

Next I added the python script activation/deactivation to the startmotion and stopmotion scripts so that I can have everything start and stop at the same time with a single command.

$ sudo nano startmotion

Then add a new line 2 so that the full file looks like this:

1
2
#!/bin/sh
nohup python ~/mmal/sleeplogger.py 1>/dev/null 2>&1/dev/null 2>&1

Then ctrl-o and ctrl-x to save and exit the file.

$ sudo nano stopmotion

Then add a new line 2 so that the full file looks like this:

1
2
3
#!/bin/sh
ps -ef | grep sleeplogger | awk '{print $2}' | xargs kill
ps -ef | grep motion-mmal | awk '{print $2}' | xargs kill

Then ctrl-o and ctrl-x to save and exit the file.

Then I tested everything out again by running ./startmotion and ./stopmotion, and reset my Arduino sketch back to once per minute.

Run the experiment

At long last I’m ready to run the experiment. Since initially writing this I’ve actually captured a few full nights worth of data, and everything is working. Unfortunately, while I was kicking my blanket almost every night before and throughout setting up this experiment, since then the weather has changed and I’ve moved to a new apartment and I don’t seem to be doing it anymore. But there is a good chance that it will begin again with colder weather, and then I’ll be able to use this setup to do my investigation.

To be continued…


Reasserting the Personhood of Children


This is Part 1 of a series of posts called
How Kids Are Bypassing School in Order to Learn.


I read Orson Scott Card’s Ender’s Game as a teenager. It’s a scifi novel in which gifted children are trained from a very young age in military strategy to fight in adult wars against alien invaders. The story itself had an impact on me, but long after the plot details faded a brief passage from the book’s introduction has stuck with me vividly.

In it, Card recounts the story of a guidance counselor for gifted children who read his book and hated it. “The criticism that left me most flabbergasted,” Card writes, “was her assertion that my depiction of gifted children was hopelessly unrealistic.… It was important to her, and to others, to believe that children don’t actually think or speak the way the children in Ender’s Game think and speak…

Yet I knew—I knew—that this was one of the truest things about Ender’s Game.… Because never in my entire childhood did I feel like a child. I felt like a person all along—the same person that I am today. I never felt that I spoke childishly. I never felt that my emotions and desires were somehow less real than adult emotions and desires. And in writing Ender’s Game, I forced the audience to experience the lives of these children from that perspective—the perspective in which their feelings and decisions are just as real and important as any adult’s. [Emphasis mine]

This problem is present not just in education, but throughout society. Any lasting learning paradigm must acknowledge the cultural changes that need to take place to accept children as functional people and treat them as such.

In his delightfully meandering essay “Murder in the Kitchen” philosopher Alan Watts contextualized the problem:

Children are a special class of human beings which came into existence with the industrial revolution, at which time we began to invent a closed world for them, a nursery society, wherein their participation in adult life could be delayed increasingly—to keep them off the labor market.

The industrial revolution had a lasting impact on how children were perceived and treated. Children were stuffed into a bubble in an effort to protect them from dangerous factory jobs. Today those factory jobs are mostly gone. In an information economy, keeping children out of society stunts their learning and development.

Watts continues:

Children are, in fact, small adults who want to take part in the adult world as quickly as possible, and to learn by doing. But in the closed nursery society they are supposed to learn by pretending, for which insult to their feelings and intelligence they are propitiated with toys and hypnotized with baby talk. They are thus beguiled into the fantasy of that happy, carefree childhood with its long sunny days through which one may go on ‘playing’—in the peculiar sense of not working—for always and always. This neurotic suppression of growth is outwardly and visibly manifested in the child’s toy world of plastic and tin, of miniaturized won’t-work guns, airplanes, cars, kitchen ranges, dinner sets, medical kits, and space rockets, designed so to entrance them that they will keep out of the way of adults….

In truth, children resent their nursery world but are given no opportunity to go beyond it.

In the time since Watts published his essay in 1971, technology has finally begun to give children that opportunity to participate in society directly. Increasingly, almost any device connects to the greatest aggregations of knowledge in human history.
Continue reading “Reasserting the Personhood of Children” »

Quantified Posture: A LumoBack Review

It haunted me. Like a weird posture peddler, the ad followed me everywhere I went online. Apparently one  visit to Lumo’s site a few months ago was enough for Google’s ad network to put a Lumo ad in front of me on what felt like every site I visited.

I probably wouldn’t even have noticed if I wasn’t already intrigued. I have wanted to fix my posture for years. When I see someone about to take a photo of me, I make a conscious effort to stand straighter. But when I see the resulting photos I still often feel like I’m not standing as tall as I would like.

And yet I hesitated. Realtime feedback aside, I like to know that I can analyze my data later and compare it with data from other sources in order to get a fuller picture and run experiments. I had read that the LumoBack API wasn’t ready, so despite promises, I was concerned that the data would be stuck in the device, not readily available for external analysis. Every now and then I would do a search for LumoBack API, and finally I found the droids I was looking for. I couldn’t get access to the API or its documentation without an account, but it was enough to make me take the plunge.

Initial Experience

Lumo is pretty good at detecting whether I’m sitting, standing, or walking, although it doesn’t always pick up on the transitions between them very quickly. I found that occasionally it would take up to 30 seconds to realize I had stood up from a sitting position. It is possible to force it to know that you’re sitting or standing with a simple swipe, which hopefully teaches it to be quicker in the future.

There are several levels of sensitivity, depending on how much you want to be able to slouch before Lumo corrects you. I went immediately to the most sensitive setting, which turns Lumo into an all-out posture Nazi. While you’re sitting, that is.

Lumo is much more strict when you are sitting than when you are standing or walking, even on the most sensitive setting. I have to lean quite a lot while I’m standing before Lumo reacts. There is likely a good reason for this; as I move through my daily life, there are times where it is certainly okay to be a little out of position. That said, it does give the perception that the realtime feedback is less useful for standing and walking posture than it is for sitting posture.

Further tests may help determine whether this perception is warranted.

Update: after another day with Lumo and some additional introspection, I’m finding that my posture concerns when sitting are primarily with my lower back, which is where the LumoBack excels. When standing, my problem is more often with the upper back/shoulders, which is outside of what Lumo primarily tracks. When walking or driving, Lumo seems to ignore posture.

Presentation

Out of the box, the presentation is nicely done. The setup instructions are simple and straightforward. The calibration is easy. No problems connecting Bluetooth to my iPhone 5 running iOS 7.0. My LumoBack model is version 3.0.5.

Car Trouble

Wow. Apparently car seats are terrible for good posture. Maybe it’s just my car seat, although I did also have similar trouble in a rental car recently. Previously I thought I had my car seat set in a position that would help me to sit up better, but apparently I couldn’t have been more wrong. While I can very quickly find my good posture in a normal chair, in the car it was nearly impossible. I spent a good 5-10 minutes adjusting my car seat and my posture to get Lumo to stop burning a hole in my lower back and still couldn’t maintain a good position for more than about 30 seconds at a time.

I would have to lean forward against the seat belt and away from the back of the seat, which is curved in a way that doesn’t allow for a straight back. The whole experience was incredibly awkward and frustrating. I tried to maintain posture as best I could and adjust the seat to try to support it.

One of the more interesting and unique metrics the LumoBack has to offer is that it can automatically detect the amount of time you spend in the car. Presumably it determines this purely through accelerometer data. So before the car actually starts moving, Lumo doesn’t know you’re in a car and just assumes you’re sitting normally just like any chair.

Continue reading “Quantified Posture: A LumoBack Review” »

Experiment: Does Running in Cold Weather Make Me Burn More Calories? (Part 5)

I’ve just discovered something really interesting in my last few runs (from my Running Cold Experiment, see Part 1Part 2Part 3, Part 4) that I may not have noticed had I not implemented BodyMedia’s suggested methodology. Check this out:

Here was Trial 9 (today from 7:20-7:30, at a WARM 62ºF) with a little extra data on either side. Notice how quickly the chart falls back down to under 2 calories per minute once I stopped running at 7:30.

Trial 9 Chart

Now look at Trial 7 (4/14 from 3:08-3:18, at a WARM 61ºF). Again, notice the similar results, especially the fast dropoff after 3:18pm when I stopped running:

Trial 7 Chart

BUT now check out Trial 8 (4/19 from 3:52-4:02, at a COLD 37ºF). I stopped running at 4:02:

Trial 8 Chart

The dropoff on Trial 8 was not nearly so steep. The calorie burn continued to be elevated well after I stopped running. So although my maximum burn was not affected that much DURING the run, afterward I continued to burn calories at an accelerated rate.
These are only 3 data points, but I found this to be very interesting. It’s also something that would not show up in my regular data chart because I’m not including the cooldown data for this particular experiment. Could be something interesting to explore in the future. I just hope I get more cold days!

Biometrics of Jurassic Park 3D

Once upon a time I studied to take the SAT. To that end, I took an SAT prep class and in said class they mentioned the importance of nutrition for studying. Because, they said, the brain becomes a major calorie-consuming organ when it is taxed with difficult tests.

Assuming this was true, I wondered if the same principal would correspond with emotional, as well as intellectual, engagement. And I saw an opportunity to run an experiment:

Jurassic Park was one of the movies that had a major impact on me as a kid and influenced my decision to go to film school. But I never had a chance to see it in the theater – until now. So I wore my BodyMedia armband during a showing of Jurassic Park 3D in order to record my calorie burn.

I had this great plan. I knew that this is a movie that has a major effect on me, which I hypothesized could also have an influence on my calorie burn at different parts of the movie. So the plan was that once I got back home I would take a look at the calorie graph, find any peaks and troughs, then go back through the movie on DVD and correlate my calorie burn to different events in the movie.

The result would be a sort of “heat map” of my level of captivation with movie magic.

The bottom line:

Calorie Burn Jurassic Park 3D

…and flatline.

It turns out that if there’s one lesson I can learn from this experiment, it’s that in terms of calorie burn, sitting is sitting no matter how engaged you are in the movie!

I probably could have picked a better metric… I imagine that wearing a heart rate monitor would have revealed a graph with a bit more variability.

Also, in spite of being involved in the movie, I’ve also seen it a million times and there are no longer any surprises for me. It’s possible that surprises could have burned more calories, although heart rate is almost certainly a better way to go in the future.

It appears that the main factor affecting movie-watching calorie burn rate is whether or not you get up to go to the bathroom during the movie.

It also makes me want to wear the BodyMedia armband during the GRE or some other sedentary, high stakes testing situation to see about those brain calorie burn claims.

Experiment: Does Running in Cold Weather Make Me Burn More Calories? (Part 4)

It’s been a while since I last wrote about my Running Cold Experiment and in that time I’ve completed several more trials. See Part 1, Part 2, and Part 3. Here’s what they look like:

Data

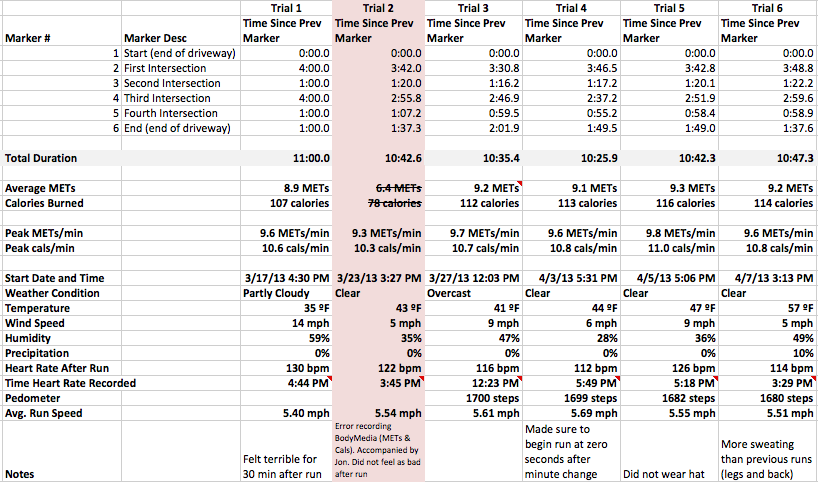
trial6data

Revisiting my methodology

More interestingly, I discovered another issue with my methodology, again having to do with the fact that I only get minute-level resolution on my calories and METs, while most of my runs finish somewhere between the 10:30 and 11 minute mark.

I returned to the raw data in order to modify the Average METs and Calories Burned measurements for Trials 3 and 4 to include the 11th minute (they didn’t before, in previous posts). I did this because I thought it more appropriate to include the 11th minute in the calculations for Trials 5 and 6 because they were much closer to the 11 minute duration mark than the 10 minute mark, and I wanted to keep all the trials as consistent as possible.

But I am realizing that this is still problematic, and I needed some help to figure it out. There were some important things I needed to understand about how BodyMedia records their data in order to improve my methodology for how to record the samples.

So the problem is this: if I cut the data off at 10 minutes for the purposes of comparison, I effectively introduce a new variable to the experiment, which is the distance I run. It would make it different for each trial.

But if I include the 11th minute, that is problematic as well because it includes a substantial amount of cooldown time for my faster runs, which negatively impacts the average calories and METs for the run.

I was also noticing that when I looked at the data points closely and attempted to run my own averages, I was getting different numbers than what BodyMedia was calculating. Something just seemed to be off.

So I wrote to BodyMedia about the issue, and they took the time to write me a wonderfully detailed response to help me understand the finer points of how the armband works, and gave some good suggestions for making my experiment more rigorous.

Help from BodyMedia

Here are paraphrases of my questions and their response:

Me: I’m getting different averages from my manual calculations than what I see displayed in BodyMedia’s Activity Manager for the same period. Am I doing something wrong?

BodyMedia: Energy expenditure values represent the value over the minute. See the attached document [Nick: see “Feature Generation” on the page marked 1616] for how the sensors are sampled over the minute.

[Nick: in other words, when a calorie value is displayed for 5:34pm, it is the sum of the calories that were burned from the start to 5:33pm to the start of 5:34pm. It shows the calorie burn over the previous minute. Up to now I had been looking at it the other way, that 5:34pm would mean the start of 5:34pm until the start of 5:35pm. This explains why my calculations were off and everything immediately started matching up once I fixed it]

Me: Since I only get by-minute resolution, how can I deal with device synchronization issues (i.e. 5:34pm on my phone probably started before or after 5:34pm on my BodyMedia armband, so how do I know I’m looking at the appropriate time range on each device)?

BodyMedia: Minute resolution for energy expenditure is all that is available for Activity Manager.  SenseWear [BodyMedia’s enterprise version of the product designed for clinicians and their patients] users can set from 32Hz to 10 minute granularity…

Standard experimental procedure would have you avoid end effects by not using end data points. I would suggest using the 8 minutes of steady state data. If you want 10 minutes of data for your analysis, record for 12 minutes.

I start and end a lot of my experiments with 2 minutes of no steps. This helps me identify the boundaries of the test. You are guaranteed to get one minute of no steps in your data file (minimal energy expenditure) and I do not use that minute or neighboring minutes.  2 minutes on your watch give one full minute of  no steps and minimal Calories in the data because of any misalignment between the armband time and your watch time.

Action Items

This information really helped me to focus the experiment:

  1. Revisit my BodyMedia data to make sure I am referencing the right time frame (i.e. timestamp 5:35pm = what happened between 5:34 and 5:35, not 5:35 and 5:36)
  2. Start standing still for 2 minutes of no steps immediately before and after my run in order to help delimit it in the data
  3. Start excluding the first and last minute of the run in my data. In other words, look at my shortest run, take the time frame that starts in minute 2 and ends in the second to last minute, and apply that time frame to all of the trials. This will help to get the best consistency. Fortunately I still have all my raw data so I can go back and adjust my existing metrics.

Next: See Part 5 where I start to make some comparisons across runs.

Experiment: Does Running in Cold Weather Make Me Burn More Calories? (Part 3)

Trial 3 of my Running Cold Experiment has brought with it some new insights. Each trial seems to help me rethink how to best capture the data I need. (Read Part 1 and Part 2).

I’ve decided that I am in an early phase where I am still defining the experiment. I will most likely need to throw out my first few data points as I continue to refine the process which should lead to better results. The alternative would be to lock in an inferior experimental method, which I think is far less desirable. That said, I am running out of cold days! So there is some time pressure to get it right.

New Metrics

I don’t yet know what all the factors are that may or may not have an effect on my runs. So for a while I am going to collect as many additional metrics as possible to help control for them. To that end, I discovered a new resource for weather data at wunderground.com.

I am hoping that once I have data from enough trials I will be able to account for things like wind speed and humidity by running some regression analyses, although I don’t currently know what is the minimum amount of data needed to do that with any sort of statistical rigor (I’ll research it once I’m closer).

I can say that qualitatively they have not had a noticeable effect, unless they contribute to making it feel warmer or colder than it actually is outside (likely). I haven’t noticed the wind much except in my latest Trial (Trial 3, today), between markers 2 and 4.

Data

Trial 3 Results

trial3data

Observations

It is proving harder than I thought to stay consistent with my run times. I started out too fast in Trial 3 and reached Marker 2 thirty seconds early. Then I slowed down to try to compensate, but ultimately ended up finishing 15 seconds faster than Trial 2, which was already faster than Trial 1. Under normal circumstances this would be encouraging as it indicates progress in terms of physical fitness, but in the context of this experiment I need to try harder to maintain consistency.

I suppose one way to look at it is to try to separate my exercise from my experiment. Another option would be to throw out Trial 1 and use Trial 3 as my new baseline. Right now it is far more appealing to just throw out my early data so that I am not constrained into the run time I established when I was less in shape. I will try to modify my runs to focus at a new target run time, which it may take me a few more runs to identify.

A Solution to Trial 2‘s Data Recording Problem: A New Metric

I have a Display Device that wirelessly communicates with my BodyMedia armband to give me real-time readings of steps taken and calorie burn. I don’t normally bother with it, but this time I took it with me and monitored the trip pedometer to make sure that the device was recording throughout my run. I don’t expect the metric to be very useful beyond ensuring the device is working since the approximate number of steps I take in the mile should not vary much, but I am a fan of collecting more data than I think I’ll need.

A Note about Heart Rate

I have been bad about recording my heart rate immediately after my run. So far I have been recording it at 6 or so minutes after I stop running but it varies, and it’s enough time for my heart rate to come down significantly before it is measured, so I am not confident in the consistency of this metric.

Part of this is because of limitations with the tool I am using (Azumio Instant Heart Rate): it doesn’t measure very well when my fingers are cold; there is even a warning to that effect in the app itself. The way it works is that I place my finger over my phone’s camera, which uses the flash to light up my finger and measure slight changes in the color in order to detect my pulse. I expect that my heart rate readings will become more accurate as the weather temperature increases and I am able to take the reading more immediately after my run, or if I move to a new tool like a heart rate monitor that goes around the chest.

Preliminary Correlation?

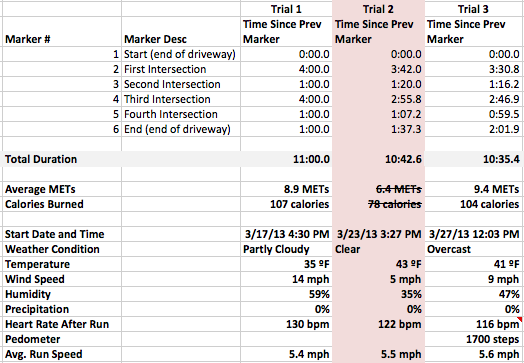
One interesting (possible) correlation I’ve noticed so far is that it appears that a longer run duration makes me burn more calories, even though this indicates that I ran faster in that period (because the distance is equal). This is evident in the following data:

Trial # Calories Burned Run Duration
Trial 1 107 calories 11 mins (and change)
Trial 3 104 calories 10 mins, 35.4 seconds

So if this is a true correlation, that would indicate if my goal were purely to maximize calorie burn, I would be better off doing longer endurance exercises than shorter high intensity exercises. That said, I can’t yet tease out what impact temperature or any of the other factors might also be having.

Once again, I have a fever and the only prescription is more data.

See Part 4 where I revise my methodology as a result of some good advice.

Experiment: Does Running in Cold Weather Make Me Burn More Calories? (Part 2)

I did a second test of my Running Cold Experiment last Saturday afternoon! Methodology was the same as Trial 1, with similar conditions, although about 8 degrees warmer.

Qualitative Data: Thoughts on Motivation and Level of Physical Fitness

I’m a bit ashamed to say that Trial 1 where I finished the mil at 11 minutes was one of my faster miles up to that point. Only a few times had I ever completed a full mile run without walking part of it.

BUT on Trial 1, my main motivation was that it was COLD. The run was very chilly at 35 degrees, which helped motivate me to push onward (and how!).

For Trial 2, it was still cold but not quite as bad, and this time my main motivation to push onward was that my brother joined me on the run, which always adds a bit of a competitive element. Although the time spent running on Trial 2 was 30 to 60 seconds shorter than Trial 1, Trial 2 felt less laborious.

After running Trial 1, I felt pretty sick for about 30 minutes afterward. This is probably because I hadn’t done much running in a long time! I recovered significantly faster and felt better after Trial 2, and was much less sore the next day, as compared with Trial 1.

I know this is not because of lowered output because I actually made better time on Trial 2. A possible explanation is that my endurance improved after the first Trial. It doesn’t seem like I should notice such a marked improvement so fast after just one run.

I don’t know what that might mean for the experiment though, because my physical condition is another factor that could potentially influence the MET and calorie measures I am tracking. In the future I will be adding Heart Rate to the metrics I track in the hope that I can use it to help control for physical fitness level.

Continue reading “Experiment: Does Running in Cold Weather Make Me Burn More Calories? (Part 2)” »

Experiment: Does Running in Cold Weather Make Me Burn More Calories? (Part 1)

I just completed the first trial of my Running Cold experiment and have some preliminary results!

I had previously defined my plan for the experiment at the end of this post.

Weather/Temperature

Here’s the weather info for today, according to Google:

Cold Experiment Weather

Attire

For the run I wore a pair of running pants, tennis shoes, a black T-shirt, and a black ski hat to cover my ears (I get headaches if I’m in the cold with my ears uncovered). Once the weather gets warmer, I’ll stop wearing the hat, but other than that I’ll make sure my attire remains the same across trials.

Continue reading “Experiment: Does Running in Cold Weather Make Me Burn More Calories? (Part 1)” »

4 Months of Calorie Burn: What Have I Learned So Far?

I now have over 4 months of BodyMedia calorie burn data:

Nov 2012 Daily Average: 2,205
Dec 2012 Daily Average: 2,123
Jan 2013 Daily Average: 2,183
Feb 2013 Daily Average: 2,114

The average seems to be going down. Why?

Is this the result of changing habits, a change in seasons, or just pure dumb luck?

Continue reading “4 Months of Calorie Burn: What Have I Learned So Far?” »